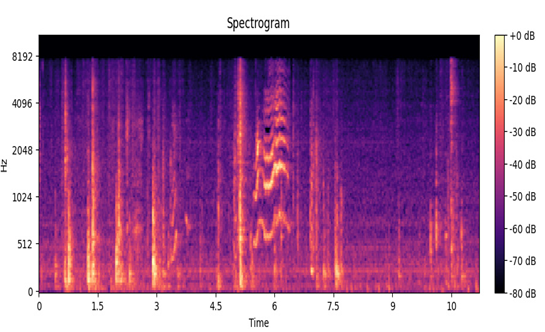
A spectrogram is a more advanced visualization that shows how the audio’s frequency content changes over time. It’s like a heat map, where different colors represent different frequencies:
Generate a spectrogram
spectrogram = librosa.feature.melspectrogram(y=y, sr=sr)
db_spectrogram = librosa.power_to_db(spectrogram, ref=np.max)
Create a spectrogram plot
Create a spectrogram plot with the y_axis set to ‘hz’ for Hertz
plt.figure(figsize=(12, 4))
librosa.display.specshow(db_spectrogram, x_axis=’time’, y_axis=’hz’)
plt.title(“Spectrogram”)
plt.colorbar(format=’%+2.0f dB’)
plt.show()
In this code, we generate a spectrogram using librosa.feature.melspectrogram(). We convert the spectrogram to dB for better visualization with librosa.power_to_db(). We create a spectrogram plot using librosa.display.specshow(). The x axis represents time, and the y axis represents frequency.
These visualizations help you see the audio data and can reveal patterns and structures in the sound. Waveforms are great for understanding amplitude changes, and spectrograms are excellent for understanding the frequency content, which is particularly useful for tasks such as music analysis, speech recognition, and sound classification.

Figure 10.8 – A spectrogram
Scenario: Frequency analysis.
Purpose: Reveals the distribution of frequencies in the signal. Useful for identifying components such as harmonics and analyzing changes in frequency content.
Mel spectrogram visualization
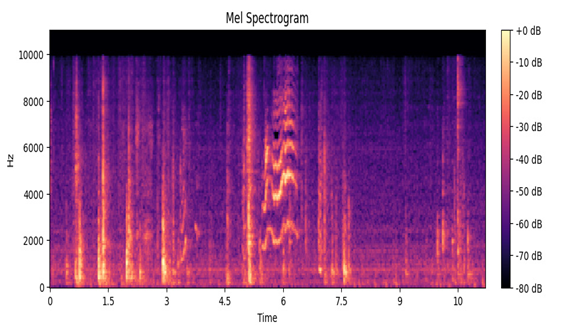
A mel spectrogram is a type of spectrogram that uses the mel scale to represent frequencies, which closely mimics how humans perceive pitch. It’s a powerful tool for audio analysis and is often used in speech and music processing. Let’s create a mel spectrogram and visualize it.
The following is a Python code example for generating a mel spectrogram using Librosa, along with an explanation of each step:
import librosa
import librosa.display
import matplotlib.pyplot as plt
Load an audio file
audio_file = “sample_audio.wav”
y, sr = librosa.load(audio_file)
Generate a mel spectrogram
spectrogram = librosa.feature.melspectrogram(y, sr=sr)
Convert the spectrogram to decibels for better visualization
db_spectrogram = librosa.power_to_db(spectrogram, ref=np.max)
Create a mel spectrogram plot
plt.figure(figsize=(12, 4))
librosa.display.specshow(db_spectrogram, x_axis=’time’, y_axis=’mel’)
plt.title(“Mel Spectrogram”)
plt.colorbar(format=’%+2.0f dB’)
plt.show()
Now, let’s break down the code step by step:
- We load an audio file using librosa.load(). Replace “sample_audio.wav” with the path to your audio file.
- We generate a mel spectrogram using librosa.feature.melspectrogram(). The mel spectrogram is a representation of how the energy in different frequency bands (in mel scale) evolves over time.
- To enhance the visualization, we convert the spectrogram to decibels using librosa.power_to_db(). This transformation compresses the dynamic range, making it easier to visualize.
- We create a mel spectrogram plot using librosa.display.specshow(). The x axis represents time, the y axis represents the mel frequency bands, and the color indicates the intensity or energy in each band.

Figure 10.9 – A mel spectrogram
Mel spectrograms are especially valuable in tasks such as speech recognition, music genre classification, and audio scene analysis, as they capture the essence of the acoustic content in a way that’s more aligned with human auditory perception.
By visualizing mel spectrograms, you can explore the frequency content and patterns in your audio data, which is crucial for many audio analysis applications.
The key difference between mel (mel frequency) and Hz (hertz) is how they represent frequency, especially in the context of audio and human perception:
- Hertz (Hz): Hertz is the standard unit of measurement for frequency. It represents the number of cycles or vibrations per second. In the context of sound and music, Hertz is used to describe the fundamental frequency of a tone, the pitch of a note, or the frequency content of an audio signal. For example, the A4 note on a piano has a fundamental frequency of 440 Hz.
- Mel (mel frequency): The mel scale is a scale of pitch perception that relates to how humans perceive pitch. It is a nonlinear scale, which means it doesn’t represent frequency linearly like Hertz. Instead, it is designed to model how our ears perceive changes in pitch. The mel scale is often used in audio processing and analysis to better match human auditory perception.
In mel frequency, lower values represent smaller perceived changes in pitch, which is useful for speech and music analysis because it corresponds more closely to the way we hear differences in pitch. For example, a change from 100 Hz to 200 Hz in hertz space represents a smaller change in pitch than a change from 1,000 Hz to 1,100 Hz, but in mel space, these changes are more equal.
In audio analysis, the mel scale is often preferred when working with tasks related to human auditory perception, such as speech recognition and music analysis, as it aligns better with how we hear sound. The mel spectrogram is a common representation of audio data that utilizes the mel scale for its frequency bands.
Scenario: Speech and music analysis.
Purpose: Enhances the representation of audio features important for human perception, commonly used in speech and music analysis.